|
|
|
01 Introduction
2024 Achievements
The 2024 Annual Report highlights a strong commitment to the responsible management of end-of-life photovoltaic panels, supported by an increasingly efficient, transparent, and regulation-compliant system.
PV CYCLE ITALIA promotes raw material recovery and reduces environmental impact, thereby supporting the circular economy.
Throughout 2024, we responded promptly to the challenges posed by an ever-evolving regulatory framework and the growing focus on sustainability, reinforcing our role as a benchmark in Extended Producer Responsibility (EPR) for electrical and electronic equipment.
Our work is grounded in legality, traceability, and sustainability, made possible through the collaboration of members, partners, and stakeholders.
We continue to invest in enhancing environmental reporting to deliver clearer and more reliable communications. We thank everyone who contributed to making 2024 a year of growth toward a sustainable future.
Rosa Narcisi – Country Manager Italia

|
|
|
02 Photovoltaic panels put on the italian market in 2024
Solar Panel Launches 2024: Growth and Responsibility
In 2024, companies affiliated with PV CYCLE ITALIA declared the placement of 6 million photovoltaic panels on the market. Although this figure is slightly lower than the record set in 2023, reflecting a modest decline in the photovoltaic market, it remains substantial and confirms the sector’s solid presence in Italy. In recent years, there has been a significant increase—from less than half a million panels in 2016 to over six million in 2024—demonstrating rapid sector growth and the increasing attention companies are paying to environmental regulations.
Extended Producer Responsibility plays a fundamental role by ensuring the proper management of panels even at the end of their life. PV CYCLE ITALIA supports companies throughout this process, promoting transparency and sustainability in waste management. Thus, the 2024 figure represents not just a number but a concrete commitment to more responsible management and a sustainable future.
|
|
|
03Life Cycle Assessment
LCA: Environmental Impacts of End-of-Life Management
Life Cycle Assessment refers to the collection and evaluation of inputs, outputs, and potential environmental impacts associated with a product, service, or organization throughout its life cycle, from the extraction of raw materials to end-of-life management.
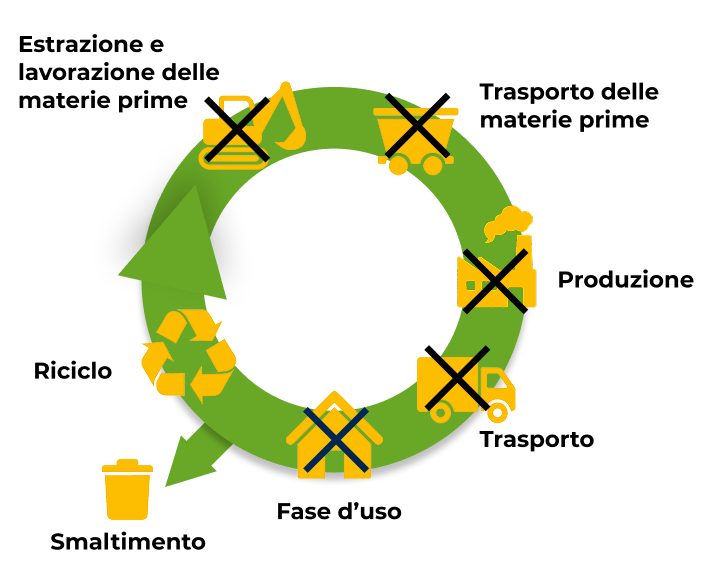
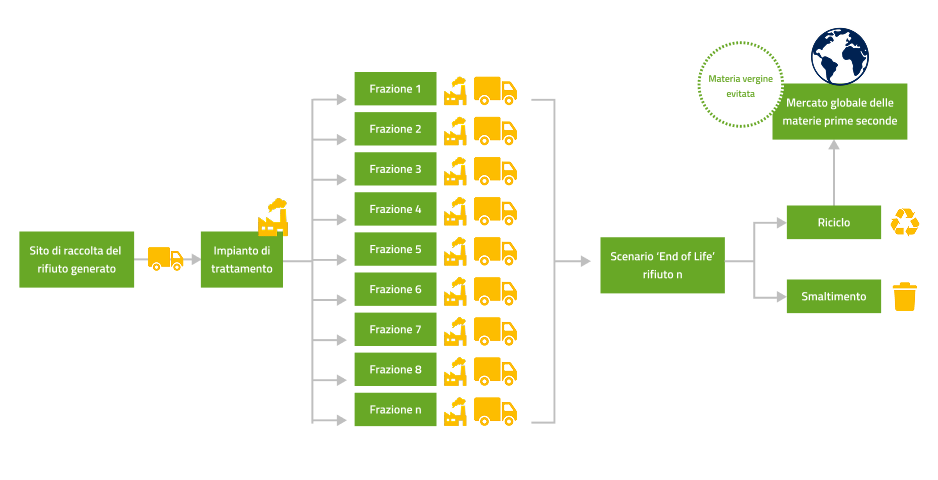
In this case, the study analyzes the life cycle of waste. Therefore, it begins not with the extraction of raw materials, but with the collection of waste, and ends with its final treatment, whether through the recovery of secondary raw materials (SRMs) or disposal.
The end-of-life LCA is carried out using the “avoided product” approach, which considers, in addition to the net impacts of waste treatment and related fractions, the quantity of material recovered based on the recycling efficiency of the treatment plants.
The aim of the study was to assess the environmental impacts resulting from the end-of-life management of professional photovoltaic panels and household WEEE (Waste Electrical and Electronic Equipment) managed by PV CYCLE ITALIA in 2024.
LCA Analysis: composition of the sample analyzed
The total amount of photovoltaic panels managed by PV CYCLE ITALIA in 2024 is 4,124.5 tons:
- 95.4% corresponds to crystalline silicon technologies (monocrystalline and polycrystalline);
- 2.3% corresponds to CI(G)S thin-film technology;
- 1.9% corresponds to amorphous silicon technology;
- 0.4% corresponds to CdTe and ceramic technologies.
| Type of photovoltaic panel | KG managed by PV CYCLE ITALIA in 2024 | Number of pieces | % of total panels |
|---|---|---|---|
| Crystalline silicon | 3934871 | 163469 | 95.4% |
| Thin film CI(G)S | 94471 | 6186 | 2.3% |
| Amorphous silicon | 77173 | 3676 | 1.9% |
| CdTE and ceramics | 17970 | 1198 | 0.4% |
| Total | 4124485 | 174529 | 100% |
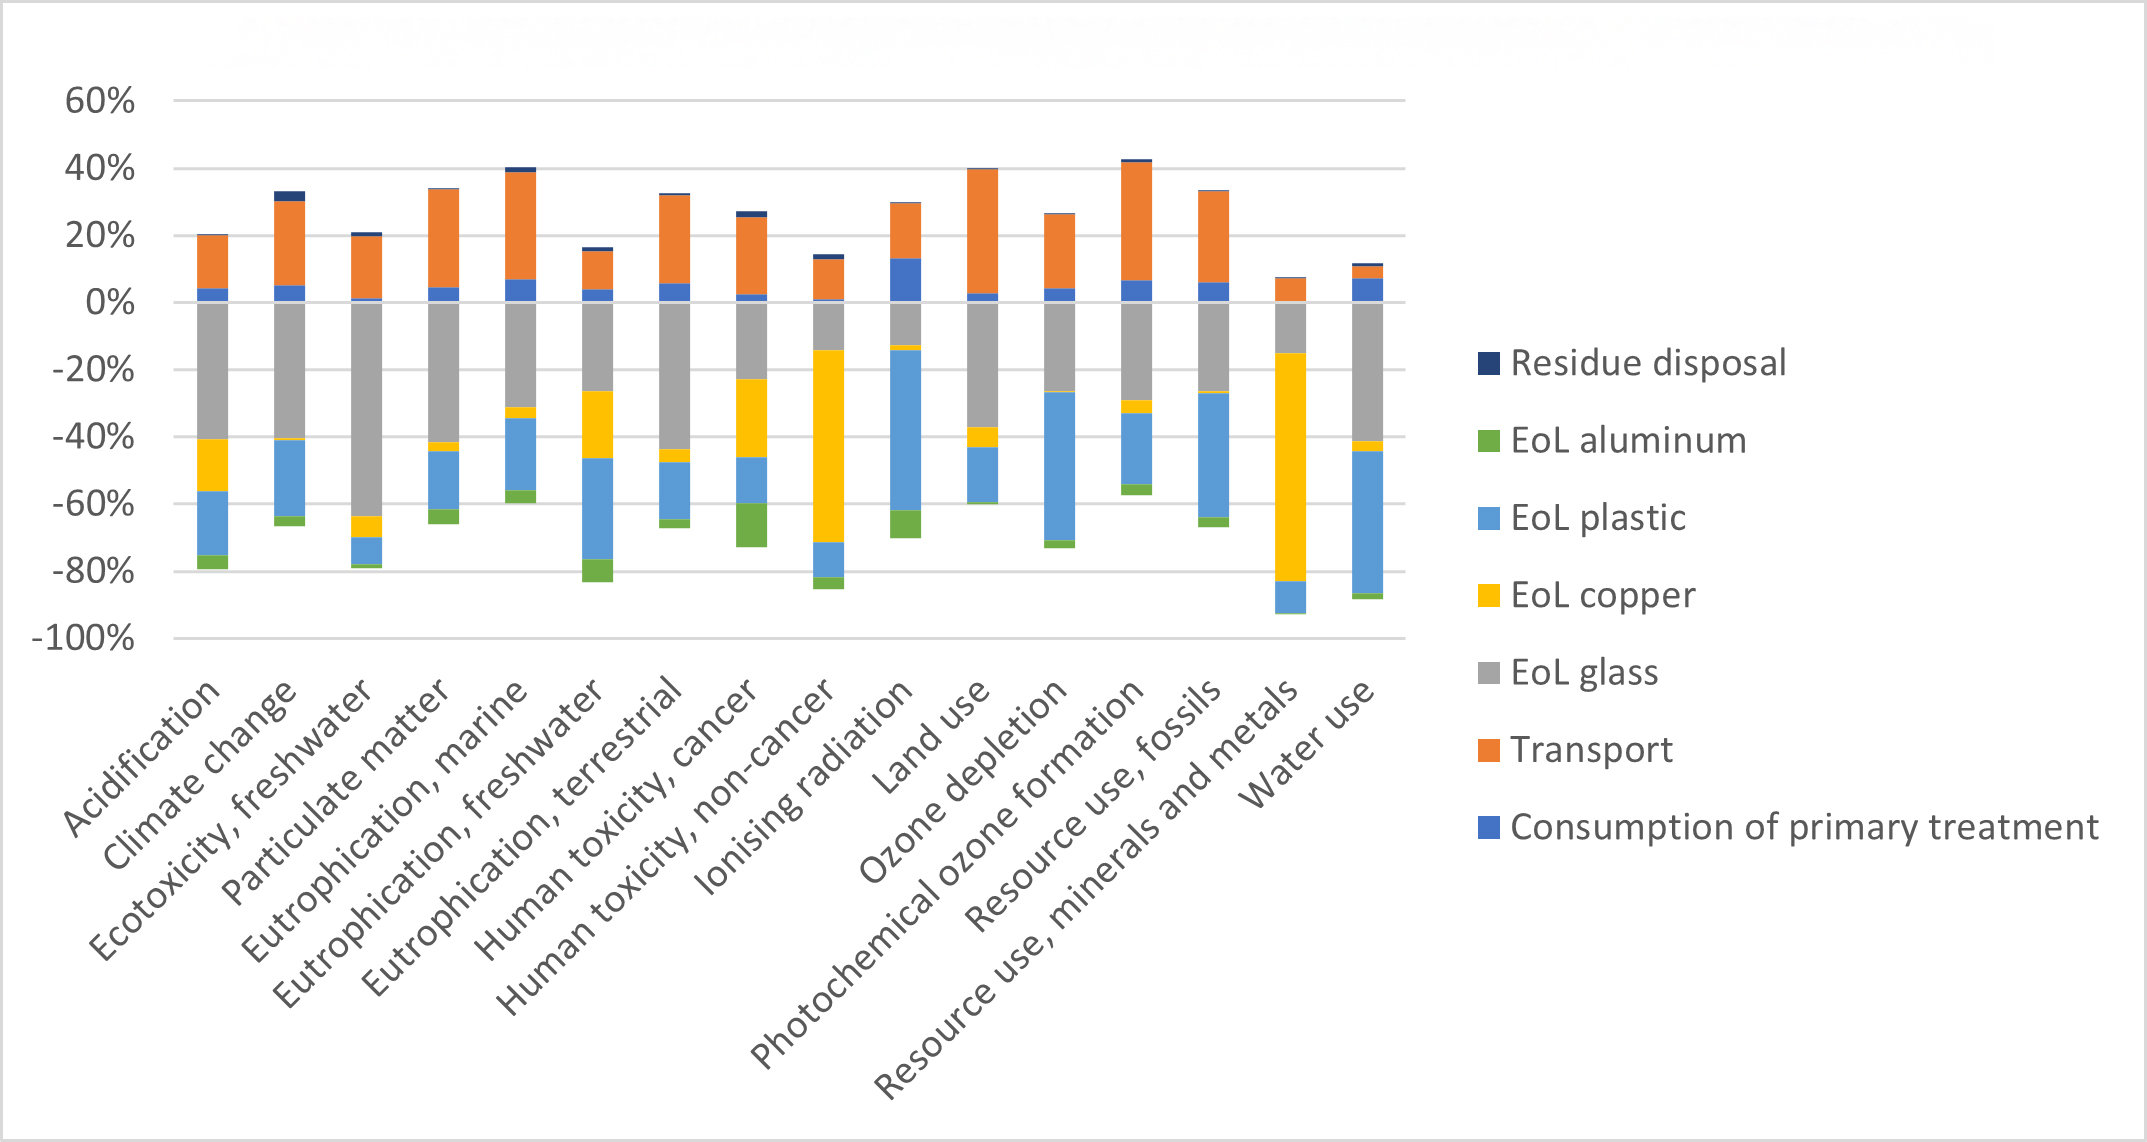
LCA Analysis: the end-of-life of professional-origin crystalline silicon photovoltaic panels
PV CYCLE ITALIA managed 3,934 tons of crystalline silicon photovoltaic panels.
The total avoided impact, thanks to the treatment efficiencies of the plants, amounts to -8,052,516.6 kg of CO₂ equivalent.
This value corresponds to the life cycle emissions of 1,000 medium-sized Euro 5 gasoline cars, each traveling 30,000 kilometers.
| Fraction | Crystalline Silicon PV (c-Si) |
|---|---|
| Copper | 1.9% |
| Aluminium | 17.5% |
| Plastic | 14.4% |
| Glass | 66.2% |
The end-of-life impact analysis of crystalline silicon photovoltaic panels highlights an energy saving of -101,575.2 GJ, equivalent to the average annual consumption of approximately 10,450 Italian households.
Regarding material consumption, PV CYCLE ITALIA achieves an annual saving of -825.7 kg Sb equivalent for crystalline silicon panels.
The process enables the recovery of various materials, including aluminum, copper, glass, and plastic.
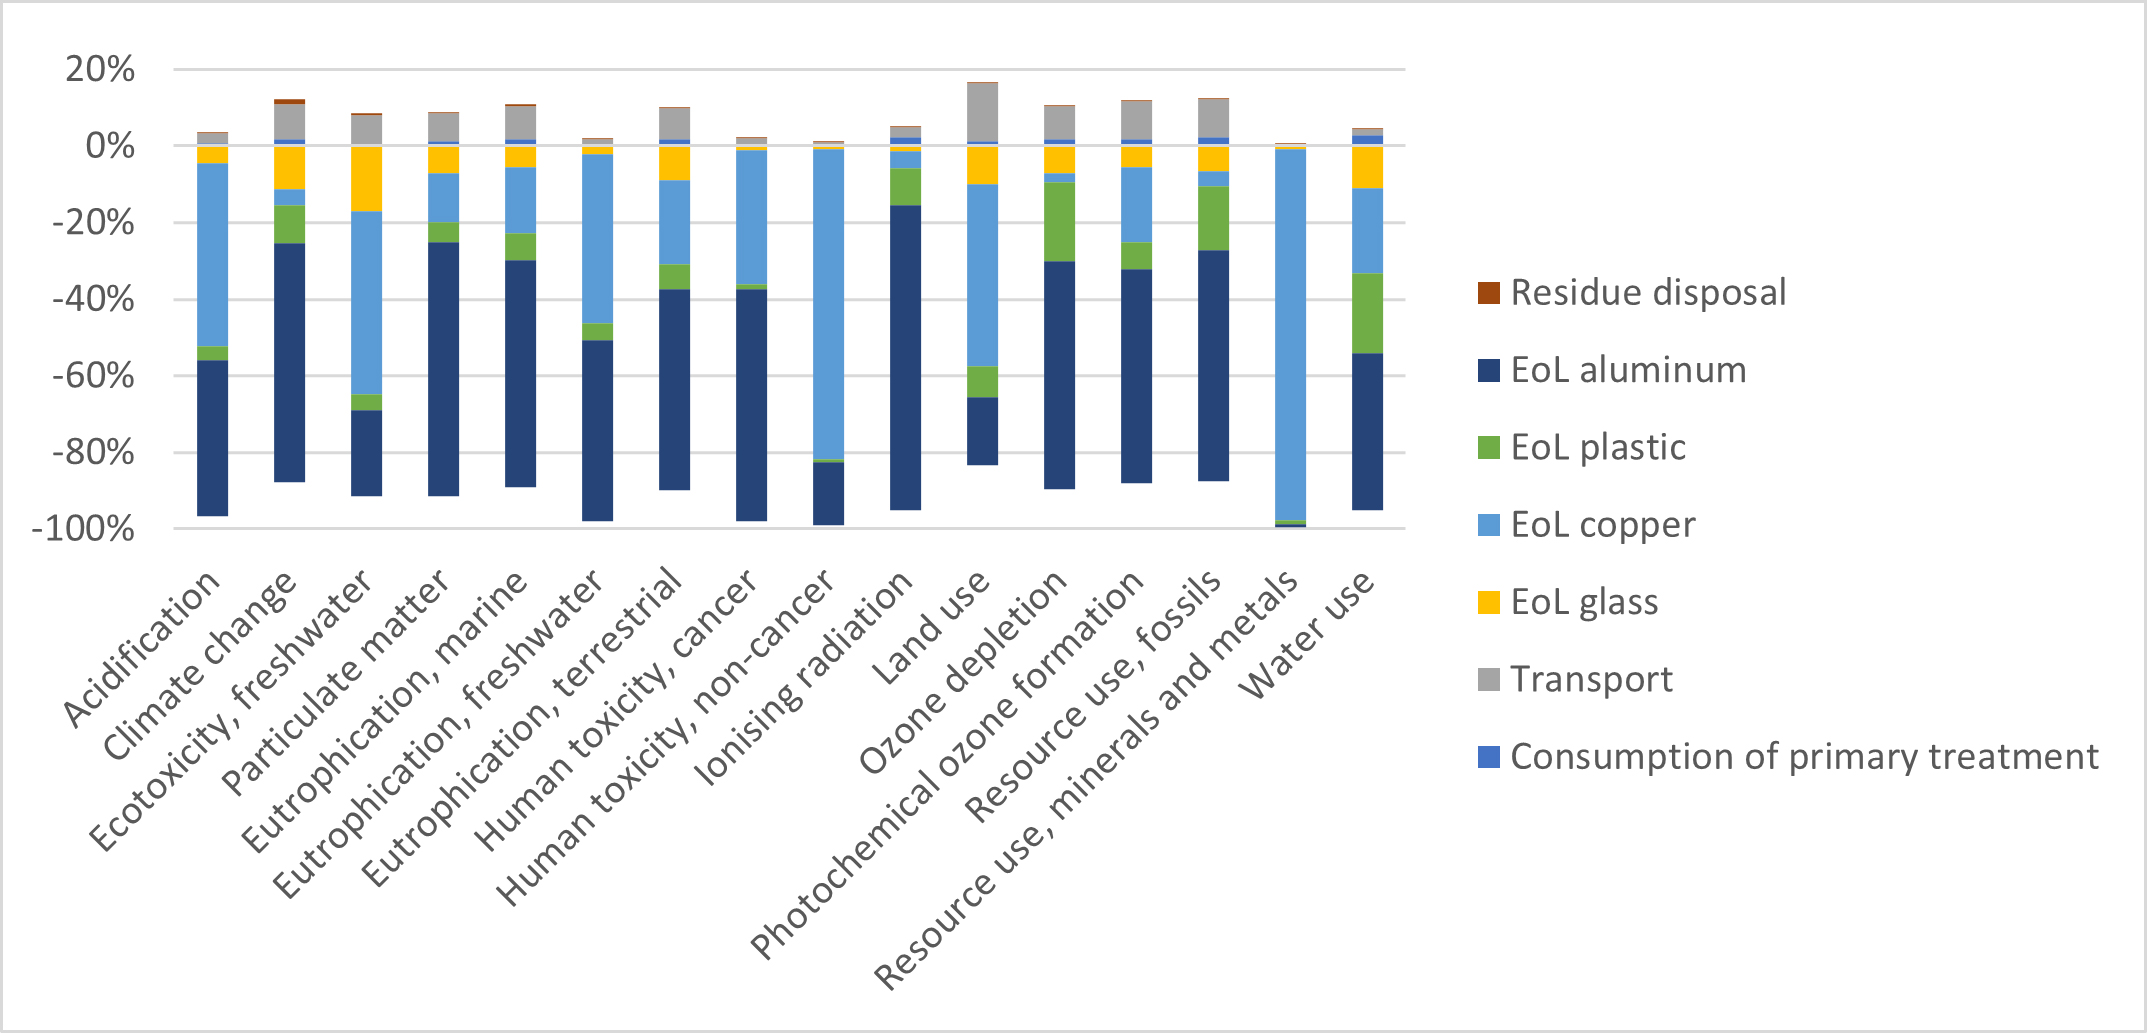
Contribution Analysis for the Crystalline Silicon Photovoltaic Panel
The bar chart illustrates the contribution of each process stage to either the environmental impact or benefit within a given impact category.
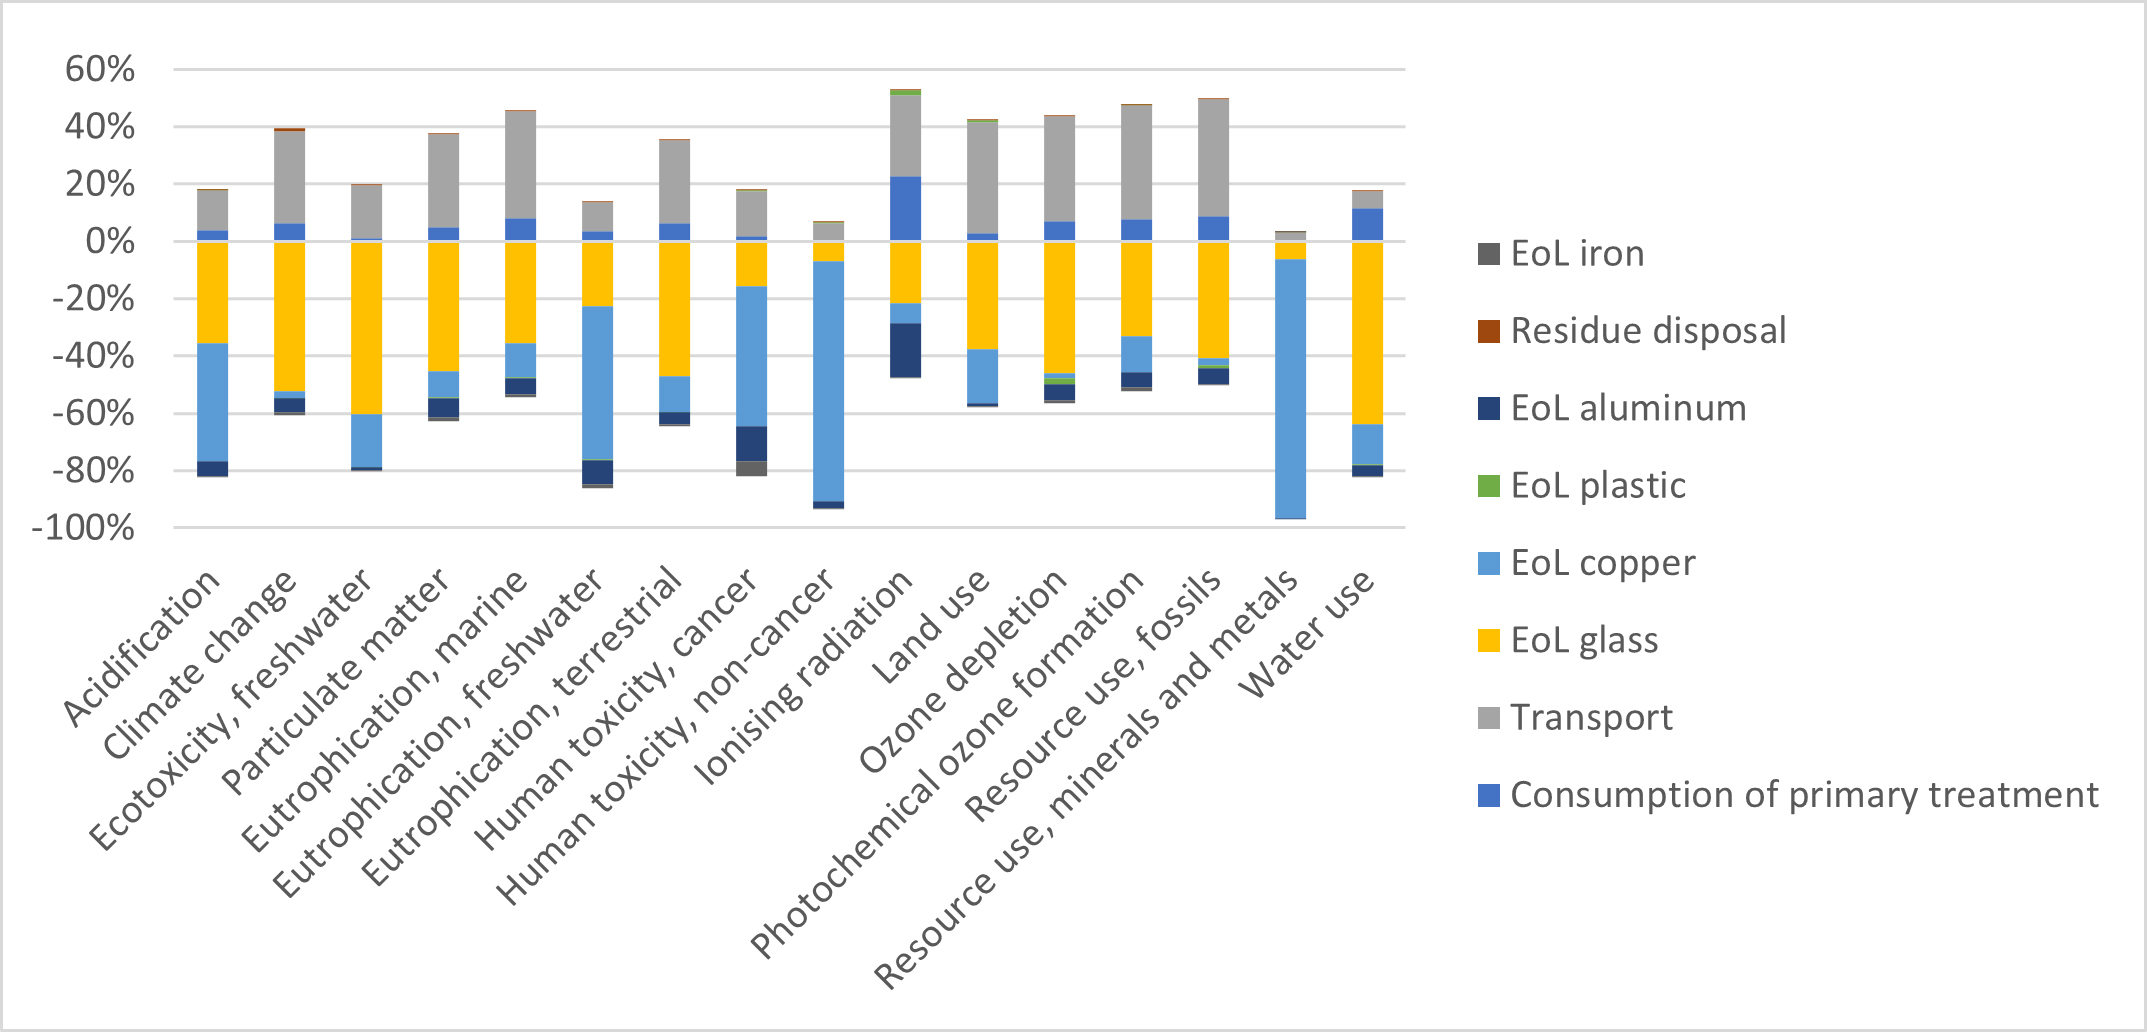
LCA Analysis: the end-of-life of professional-origin thin film photovoltaic panels
PV CYCLE ITALIA managed 94 tons of thin-film photovoltaic panels.
The total avoided impact, thanks to the treatment efficiencies of the plants, amounts to –31,202.9 kg of CO₂ equivalent.
This value corresponds to the emissions of one mid-sized Euro 5 gasoline car traveling 116,418 km.
| Fraction | CI(G)S Thin-Film PV |
|---|---|
| Copper | 0.1% |
| Aluminium | 0.3% |
| Plastic | 12.0% |
| Glass | 87.0% |
| Indium-gallium-selenide | 0.1% |
The end-of-life impact analysis of CI(G)S thin-film photovoltaic panels highlights an energy saving of -407.9 GJ, equivalent to the average annual consumption of approximately 42 Italian households.
Regarding material consumption, PV CYCLE ITALIA achieves an annual saving of -1.3 kg Sb equivalent for thin-film panels.
Thin-film photovoltaic panels are composed mainly of glass (87% by mass).
Contribution Analysis for the CI(G)S Thin-Film Photovoltaic Panel
The bar chart illustrates the contribution of each process stage to either the environmental impact or benefit within a given impact category.
LCA Analysis: the end-of-life of professional-origin amorphous silicon photovoltaic panels
PV CYCLE ITALIA managed 77 tons of amorphous silicon photovoltaic panels.
The total avoided impact, thanks to the treatment efficiencies of the plants, amounts to –12,531.8 kg of CO₂ equivalent.
This value corresponds to the emissions of one mid-sized Euro 5 gasoline car traveling 46,642 km.
| Fraction | Amorphous Silicon (a-Si) PV |
|---|---|
| Copper | 0.3% |
| Aluminium | 0.3% |
| Plastic | 0.7% |
| Glass | 97.3% |
| Other | 1.0% |
The end-of-life impact analysis of amorphous silicon photovoltaic panels highlights an energy saving of -4.0 GJ, equivalent to the average consumption of about one Italian family over five months.
Regarding material consumption, PV CYCLE ITALIA achieves an annual saving of -12.6 kg Sb equivalent for amorphous silicon panels.
The amorphous silicon photovoltaic panels are composed mainly of glass (97.3%).
Contribution Analysis for the Amorphous Silicon Photovoltaic Panel
The bar chart illustrates the contribution of each process stage to either the environmental impact or benefit within a given impact category.
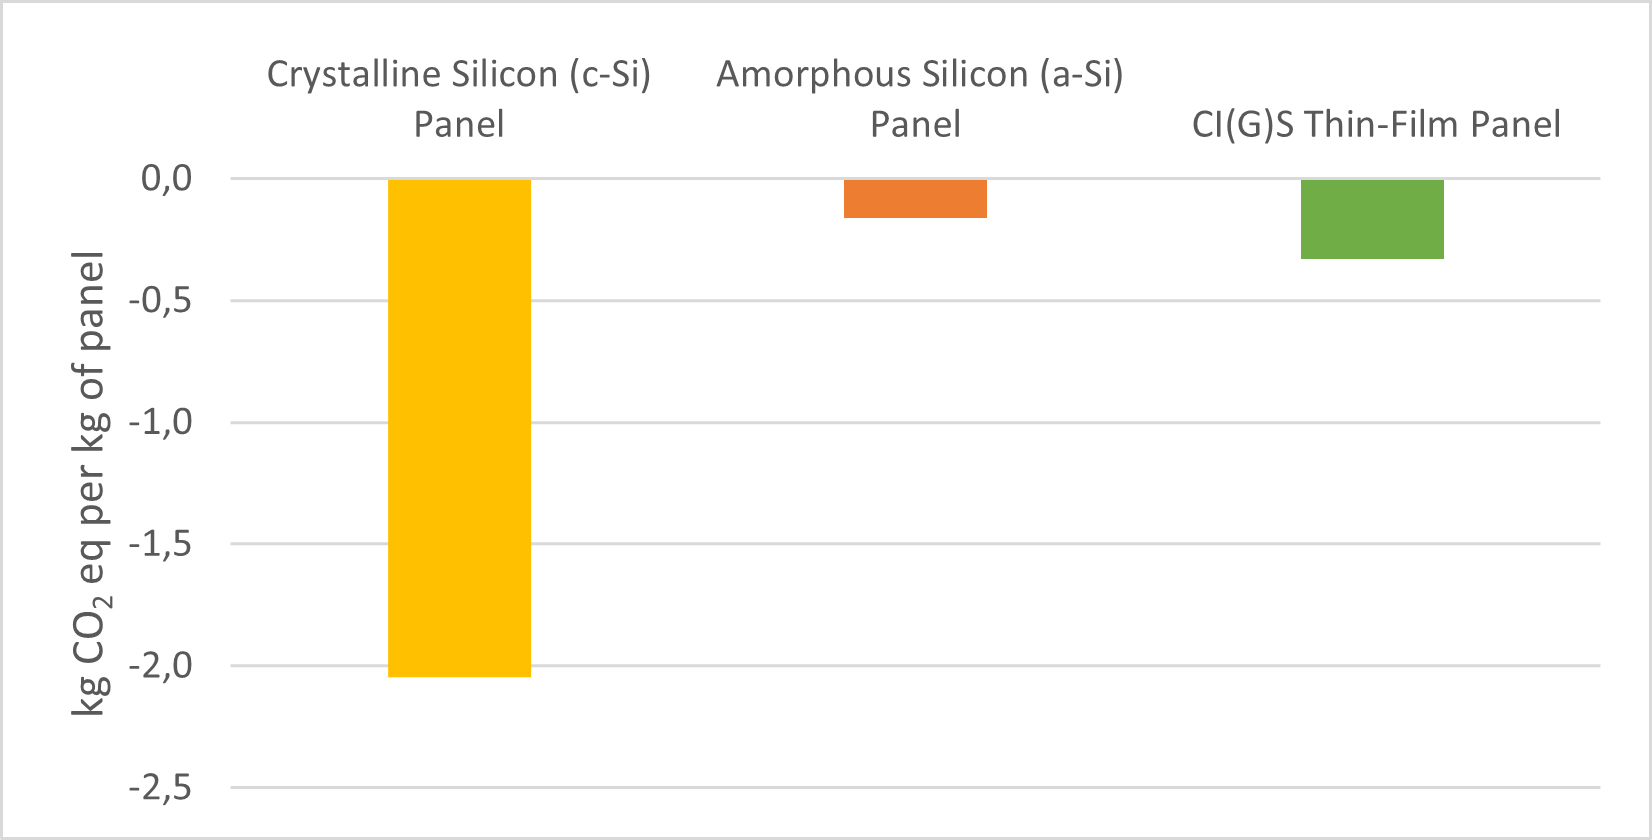
Analysis results: climate change
The comparative analysis highlights that the end-of-life treatment of crystalline silicon panels generates greater environmental benefits compared to amorphous silicon and CI(G)S thin-film panels.
The total avoided CO₂ equivalent emissions are equivalent to those produced by driving approximately 30 million kilometers in a mid-sized Euro 5 gasoline car.
Comparison results among the three types of panels for the climate change impact category
|
|
|
04Overview of household WEEE groups
Household WEEE are divided into five Groups:
- R1: Refrigeration appliances (refrigerators, freezer, air conditioners, etc.)
- R2: Large household appliances (washing machines, dishwashers, ovens, hobs, etc.)
- R3: TVs (Monitors and screens)
- R4: Various electronic products (small appliances, consumer electronics, IT and telecommunications, etc.)
- R5: Light sources
The quantities of household WEEE managed by PV CYCLE ITALIA in 2024 are shown in the following table:
| WEEE group | KG managed by PV CYCLE ITALIA in 2024 | % of total | tons of CO₂eq saved by recycling | GJ of energy saved by recycling | KG of Sb eq |
|---|---|---|---|---|---|
| R1 | 30110 | 0,36% | -32 | -290 | -2 |
| R2 | 85985 | 1,02% | -75 | -685 | -3 |
| R3 | 9069 | 0,11% | -2 | -61 | -1 |
| R4 | 8342247 | 98,51% | -5823 | -94000 | -806 |
| R5 | 822 | 0,01% | -0,25 | 1 | -0.3 |
| Total | 8468233 | 100.00% | -5932 | -95034 | -812 |
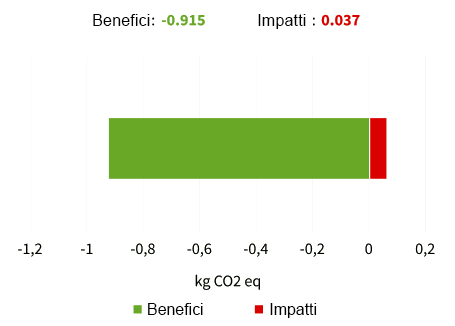
Household WEEE Group R1
PV CYCLE ITALIA managed 30.11 tons of household WEEE Group R1.
The total avoided impact, thanks to the treatment efficiencies of the plants, amounts to –31,911.65 kg of CO₂ equivalent.
This value corresponds to the life cycle emissions of a mid-sized Euro 5 gasoline car traveling 119,075 kilometers.
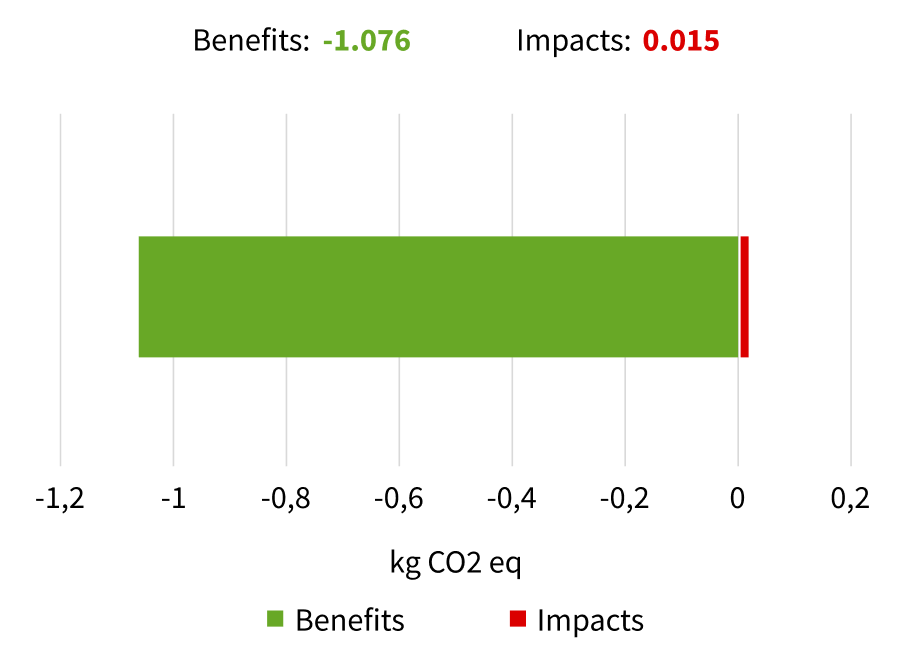
The end-of-life analysis of household WEEE Group R1 highlights an energy saving of -290 GJ and a raw material saving of -1.5 kg Sb equivalent, thanks to treatment and recycling activities.
| Fraction | kg CO₂ eq/kg | % benefits | % impacts |
|---|---|---|---|
| Steel | -0.005 | 0% | |
| Aluminium | -0.22 | 21% | |
| Iron | -0.663 | 62% | |
| Wood | -0.001 | 0% | |
| ABS Plastic | -0.001 | 0% | |
| PP Plastic | -0.012 | 1% | |
| PS Plastic | -0.117 | 11% | |
| Polyurethane | -0.011 | 1% | |
| Copper | -0.042 | 4% | |
| Glass | -0.004 | 0% | |
| CFC | 0.014 | 92% | |
| Compressor oil | 0.001 | 8% |
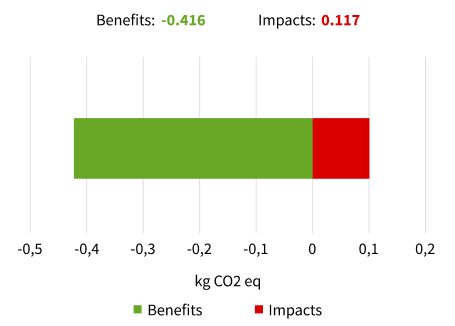
Household WEEE Group R2
PV CYCLE ITALIA managed 85.98 tons of household WEEE Group R2.
The total avoided impact, thanks to the treatment efficiencies of the plants, amounts to –75,432.78 kg of CO₂ equivalent
This value corresponds to the life cycle emissions of a mid-sized Euro 5 gasoline car traveling 281,466 kilometers.
The end-of-life analysis of household WEEE Group R2 highlights an energy saving of -684.6 GJ and a raw material saving of -3.1 kg Sb equivalent, thanks to treatment and recycling activities.
| Fraction | kg CO₂ eq/kg | % benefits | % impacts |
|---|---|---|---|
| Steel | -0,022 | 2% | |
| Aluminium | -0,144 | 16% | |
| Iron | -0,714 | 78% | |
| Wood | -0,001 | <1% | |
| PP Plastic | -0,002 | <1% | |
| Copper | -0,032 | 3% | |
| Cement | 0,012 | 33% | |
| ABS Plastic | 0,01 | 27% | |
| PA Plastic | 0,003 | 7% | |
| PS Plastic | 0,011 | 30% | |
| Glass | 0,001 | 3% |
Household WEEE Group R3
PV CYCLE ITALIA managed 9.06 tons of household WEEE Group R3.
The total avoided impact, thanks to the treatment efficiencies of the plants, amounts to –1,886.37 kg of CO₂ equivalent.
This value corresponds to the life cycle emissions of a mid-sized Euro 5 gasoline car traveling 7,039 kilometers
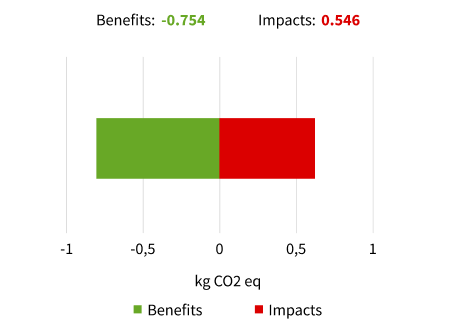
The end-of-life analysis of household WEEE Group R3 highlights an energy saving of -69.9 GJ and a raw material saving of -0.6 kg Sb equivalent, thanks to treatment and recycling activities.
| Fraction | kg CO₂ eq/kg | % benefits | % impacts |
|---|---|---|---|
| Steel | -0.111 | 15% | |
| Aluminium | -0.236 | 31% | |
| Iron | -0.111 | 15% | |
| Wood | -0.001 | 0% | |
| ABS Plastic | -0.173 | 23% | |
| Copper | -0.122 | 16% | |
| Glass | 0.035 | 6% | |
| PCBs | 0.029 | 5% | |
| PC/ABS Plastic | 0.336 | 62% | |
| PMMA Plastic | 0.145 | 26% | |
| PS Plastic | 0.001 | 0% |
Household WEEE Group R4
PV CYCLE ITALIA managed 8,342.24 tons of household WEEE Group R4.
The total avoided impact, thanks to the treatment efficiencies of the plants, amounts to –5,822,789.94 kg of CO₂ equivalent.
This value corresponds to the life cycle emissions of a mid-sized Euro 5 gasoline car traveling 22,000,000 kilometers.
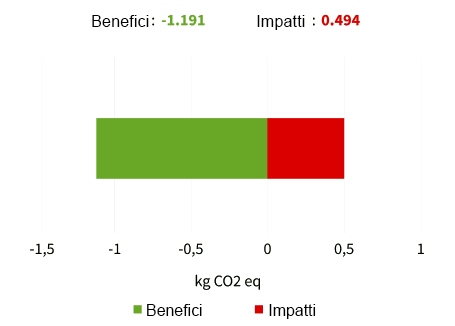
The end-of-life analysis of household WEEE Group R4 highlights an energy saving of -94,074.0 GJ and a raw material saving of -806 kg Sb equivalent, thanks to treatment and recycling activities.
| Fraction | kg CO₂ eq/kg | % benefits | % impacts |
|---|---|---|---|
| Steel | -0.027 | 2% | |
| Aluminium | -0.401 | 34% | |
| Iron | -0.505 | 42% | |
| PS Plastic | -0.113 | 10% | |
| Copper | -0.145 | 12% | |
| Glass | 0.002 | 0% | |
| Wood | 0.005 | 1% | |
| ABS Plastic | 0.337 | 68% | |
| PC/ABS Plastic | 0.15 | 30% |
Household WEEE Group R5
PV CYCLE ITALIA managed 0.82 tons of household WEEE Group R5.
The total avoided impact, thanks to the treatment efficiencies of the plants, amounts to –245.94 kg of CO₂ equivalent.
This value corresponds to the life cycle emissions of a mid-sized Euro 5 gasoline car traveling 917 kilometers.
The end-of-life analysis of household WEEE Group R5 highlights an energy saving of -1.3 GJ and a raw material saving of -0.03 kg Sb equivalent, thanks to treatment and recycling activities.
| Fraction | kg CO₂ eq/kg | % benefits | % impacts |
|---|---|---|---|
| Aluminium | -0.239 | 57% | |
| Iron and Steel | -0.028 | 7% | |
| PC Plastic | -0.047 | 11% | |
| Copper | -0.051 | 12% | |
| Glass | -0.051 | 12% | |
| PET Plastic | 0.102 | 87% | |
| Fluorescent powders | 0.015 | 13% |
|
|
|
05Conclusion
In 2024, the environmental benefits of recycling photovoltaic panels and WEEE — both from professional and household sources — significantly exceeded the impacts associated with transport and treatment.
- Avoided emissions: 14,029 tons of CO₂ equivalent, equal to 52 million kilometers driven by a mid-sized Euro 5 gasoline car — a tangible contribution to the fight against climate change.
- Fossil energy saved: 197,021 GJ, equivalent to the annual consumption of 20,269 Italian households.
- Raw materials saved: 1,643 kg of rare metals (Sb equivalent), equivalent to the weight of 16 Statues of Liberty.
These figures clearly demonstrate that material recovery makes sense: it reduces emissions, cuts waste, and conserves resources
The circular economy is not just a sustainable option — it is a necessity.